
Original article, courtesy of Politifact:
During the Republican presidential debate in North Charleston, S.C., Sen. Ted Cruz, R-Texas, took aim at the nation’s economic record under President Barack Obama.
“The millionaires and billionaires are doing great under Obama,” Cruz said. “But we have the lowest percentage of Americans working today of any year since 1977. Median wages have stagnated. And the Obama-Clinton economy has left behind the working men and women of this country.”
Cruz is on to something. One key employment statistic known as the civilian labor force participation rate is at its lowest level since the 1970s. This statistic takes the number of Americans in the labor force — basically, those who are either employed or who are seeking employment and divides it by the total civilian population.
Here’s a chart going back to the mid 1970s.
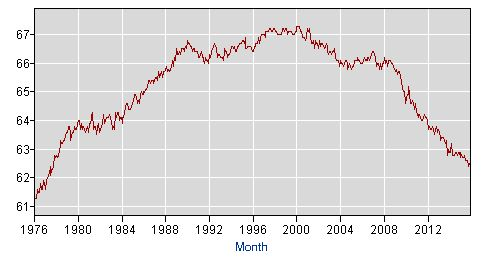
When the civilian labor force participation rate is low, it’s a concern, because it means there are fewer working Americans to support non-working Americans.
…a notable factor in the decline of the labor-force participation rate is the aging of the Baby Boom generation. As more adults begin moving into retirement age, the percentage of Americans who work is bound to decline.
…there’s another way to read Cruz’s words. He said “the lowest percentage of Americans working” since 1977, which could also refer to a different statistic, the employment-population ratio. This statistic takes the number of people who are employed and divides it by the civilian population age 16 and above.
The difference in this case is that using the employment-population ratio, Cruz’s statement is incorrect. Unlike the labor-force participation rate, the employment-population ratio has actually been improving in recent years, although it’s below its pre-recession highs.
Here’s a chart showing this statistic over the same time frame:
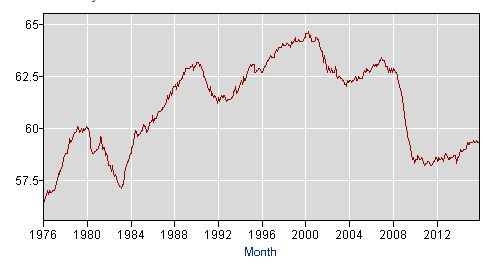
If you exclude the Great Recession, the employment-population ratio was last at its current rate in 1984, not 1977. So by that measurement, he’s close.
(Note: this blog will not meaningfully address the other major labor market issue raised by Senator Cruz–stagnant wages. Nor will it discuss strategies to alter America’s aging demographic. The primary focus is labor force participation by different age groups, the relationship between older workers staying in the workforce longer and youth unemployment, and how those issues are related to America’s Social Security system.
It is not my intention to spark inter-generational warfare, but rather to point out that a “fix” commonly floated to bring America’s fiscal house in order–raising the Social Security eligibility and retirement ages–could have significant unintended negative consequences).
—
A declining labor force participation rate is worrisome. Even the more positive statistic (employment-population ratio) is cause for concern.
But as important as what is happening, is why it is happening. Failure to accurately answer this question risks the wrong policy response, which would at best fail to solve the problem and at worst further exacerbate it. The conservative camp would undoubtedly focus on the welfare state and disincentives to work. The liberal camp would probably focus on economic inequality and the resulting lack of opportunity facing many poor, mostly minority youths.
I am not interested in getting into a partisan debate, although my regular readers know which side I generally fall on. What neither side is likely to consider (because it does not fit neatly into either economic narrative) is in what age ranges most of the employment to population ratio change has taken place. To shed some light on this, lets look at a recent analysis done by the Bureau of Labor Statistics (The BLS numbers use the 16 and older employment-population ratio definition. In the interest of full disclosure, I work for the BLS, but not in any employment statistics capacity. Furthermore, the views expressed in this blog are my own, and are not the views of the BLS).
| Group | Participation rate | Percentage-point change | ||||||
| 1994 | 2004 | 2014 | 1994–2004 | 2004–14 | ||||
| Total, 16 years and older | 66.6 | 66.0 | 62.9 | -0.6 | -3.1 | |||
| 16 to 24 | 66.4 | 61.1 | 55.0 | –5.3 | -6.1 | |||
| 16 to 19 | 52.7 | 43.9 | 34.0 | -8.8 | -9.9 | |||
| 20 to 24 | 77.0 | 75.0 | 70.8 | -2.0 | -4.2 | |||
| 25 to 54 | 83.4 | 82.8 | 80.9 | -0.6 | -1.9 | |||
| 25 to 34 | 83.2 | 82.7 | 81.2 | -0.5 | -1.5 | |||
| 35 to 44 | 84.8 | 83.6 | 82.2 | -1.2 | -1.4 | |||
| 45 to 54 | 81.7 | 81.8 | 79.6 | 0.1 | -2.2 | |||
| 55 and older | 30.1 | 36.2 | 40.0 | 6.1 | 3.8 | |||
| 55 to 64 | 56.8 | 62.3 | 64.1 | 5.5 | 1.8 | |||
| 55 to 59 | 67.7 | 71.1 | 71.4 | 3.4 | 0.3 | |||
| 60 to 64 | 44.9 | 50.9 | 55.8 | 6.0 | 4.9 | |||
| 60 to 61 | 54.5 | 59.2 | 63.4 | 4.7 | 4.2 | |||
| 62 to 64 | 38.7 | 44.4 | 50.2 | 5.7 | 5.8 | |||
| 65 and older | 12.4 | 14.4 | 18.6 | 2.0 | 4.2 | |||
| 65 to 74 | 17.2 | 21.9 | 26.2 | 4.7 | 4.3 | |||
| 65 to 69 | 21.9 | 27.7 | 31.6 | 5.8 | 3.9 | |||
| 70 to 74 | 11.8 | 15.3 | 18.9 | 3.5 | 3.6 | |||
| 75 to 79 | 6.6 | 8.8 | 11.3 | 2.2 | 2.5 | |||
| 75 and older | 5.4 | 6.1 | 8.0 | 0.7 | 1.9 | |||
| Age of baby boomers | 30 to
48 |
40 to
58 |
50 to
68 |
|||||
The change in labor force participation seems to have been driven primarily by:
- Fewer younger people working
- More elderly people working
In fact, the decline of prime working age labor force participation (say 25-55) over the last 20 years has been quite small.
It is true that once you get to the older age brackets (especially 60+), the group represents a smaller percentage of the overall population (see Table 1), so you cannot compare different groups percent changes directly. But even factoring in percentage of the total population, increases in elderly workers have had a significant impact on overall employment. As America’s population continues to get older, it will have an even greater impact:

Furthermore, according to BLS Employment Projections (2014-2024), these age related labor trends are expected to continue into the future:
The labor force participation rate for youth (ages 16 to 24) is projected to
decrease from 55.0 percent in 2014 to 49.7 percent in 2024. The youth age
group is projected to make up 11.3 percent of the civilian labor force in
2024 as compared with 13.7 percent in 2014. In contrast, the labor force
participation rate for the 65-and-older age group is projected to increase
from 18.6 percent in 2014 to 21.7 percent in 2024. This older age group is
projected to represent 8.2 percent of the civilian labor force in 2024 as
compared with 5.4 percent in 2014.
One could argue that older and younger people generally do not occupy the same job. Sometimes this is true, sometimes it is not. Furthermore, any given firm could have an older person making a lot of money in a position they intend to fill with more than one entry level worker. This is all anecdotal–without doing more research the exact relationship between older and younger workers and job openings is unknown–but surely there is some relationship (probably one that varies greatly by industry).
Next time a politician talks about raising the Social Security eligibility and retirement ages, consider:
- Poorer people (who rely on Social Security the most) are not living longer.
- Keeping people working longer means less jobs available to younger people. This also contributes to the exploding student loan debt problem in America (even those who do graduate college have a difficult time getting good paying jobs, at least partially because of competition from older, more qualified workers).
Both of these related issues–youth un(der)employment and student loan debt–create a drag on the economy, as younger people delay starting their “adult lives” (starting families, buying homes, etc.). This drag on the economic growth leads to–you guessed it–less job creation. Based on the BLS numbers, we clearly need to make youth employment a greater priority, as ignoring the problem compromises both current and future economic growth.
When we consider raising the Social Security eligibility age, we must consider unintended consequences. To responsibly increase the eligibility age, the government would have to launch a youth employment program. This could offset most (if not all) of the savings associated with raising the retirement age. Perhaps instead of raising the eligibility age, we should consider making social security a needs-based program, eliminating the cap on taxable income, or both. This may not be “fair” to people who have paid the most into the program (or those who have been more financially conservative throughout their lives), but it would make the Social Security system more financially sustainable, without the unintended negative consequences.
America does not have to enact policies that exacerbate youth unemployment and/or discomfort poorer elderly people in order to save a few bucks. Our strong financial system and global faith in America’s creditworthiness ensures we can continue to finance important programs (for people of all ages) with long term economic implications. But this global faith in America’s creditworthiness is predicated on the belief that we can correctly identify and address our structural economic problems (and thus continue to grow and repay our debts). To preserve this faith, we must work across the partisan divide to responsibly and sustainably address these problems, not recycle stale partisan arguments that are largely unrelated to the problems at hand.

